Analytics
See the feature page: analytics.
Pick Analytics in the dashboard. Everything is live, so you can know what worked by lunch rather than waiting for a weekly export.
The three numbers
Across the top: Views, Clicks, and Subscribers for the range you have chosen.
- A view is one load of your page.
- A click is one tap on one of your link blocks.
- A subscriber is one address left through an email capture block or the gate.
Under each is a comparison against the window before it, "vs prior 7d", so a rise or a fall has something to be a rise or a fall against. A short history reads "no prior window", and a first week of anything reads "first activity" rather than pretending to a percentage.
Each of the three is also a button. Press one and the chart below switches to that series.
Your own visits to your own page never count: the server checks the signed-in user against the page owner and drops the write. Known bots are dropped before anything is written, by user agent. A click is only recorded if the link belongs to your page and it is showing, so a hidden block cannot inflate anything.
Time range
The button at the top right names the range you are looking at, for example "Jul 28, 2026 - Aug 27, 2026". Open it for five presets:
- Today
- Last 7 days
- Last 30 days
- Last 90 days
- Last year
Last 30 days is what you get on arrival, and today, 7 days, and 30 days are on every plan. The 90 day and last year ranges are part of Pro; picking them on the free plan opens the upgrade panel. A year is as far back as the numbers go.
Activity
Views, clicks, or subscribers by day across the range, with the two buttons above it switching between a line and bars. Every day in the range gets a point, including the days with nothing on them, so a flat stretch reads as a flat stretch rather than as a gap.
Sources
Sources groups your views by the site that sent them, reduced to the root domain, so www.instagram.com and l.instagram.com land together as instagram.com.
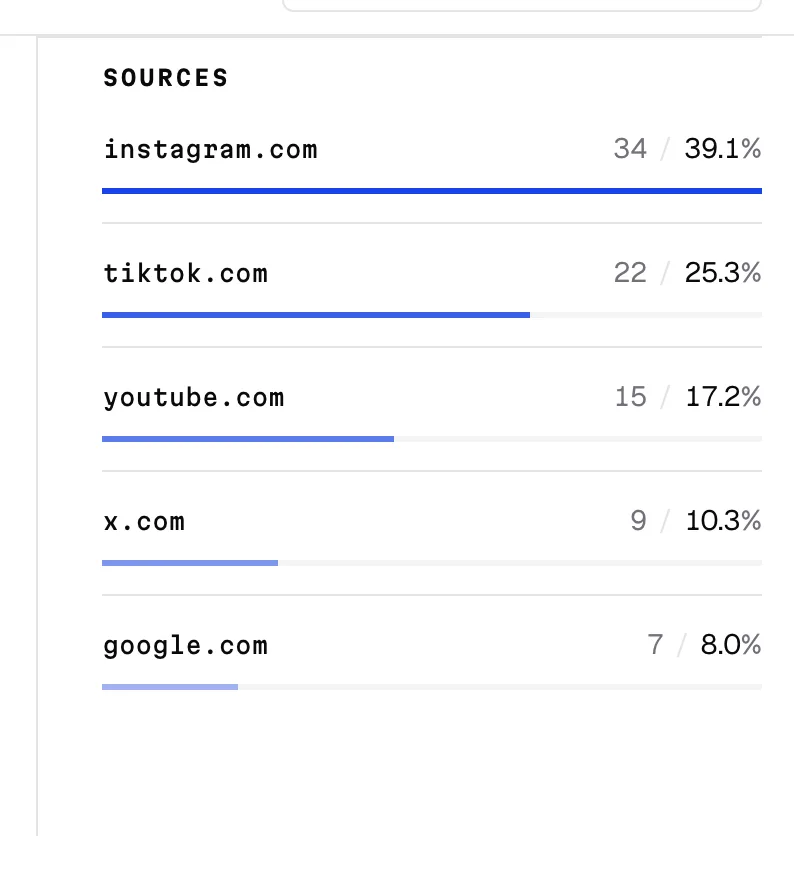
It is a ranked list rather than a pie, in order, each with its count, its share, and a bar scaled against the leader. A tail of small sources still reads as a shape that way.
Until anyone arrives from another site it reads "No referrals yet". Two things commonly cause an empty panel on a page that is definitely getting traffic: apps that strip the referrer when someone taps a link in a bio, and people typing your address in directly. Neither is something you can fix from here.
If you send posts, a line under the panel counts the clicks that came from one. A mail client sends no referrer, so those would otherwise be invisible; the only evidence is the parameter the post renderer stamped on the link.
Links
Every link on your page, with:
- Clicks inside the range, with that link's click-through rate underneath it
- Share, that link's percentage of all clicks in the range
- Shares, how many times a visitor copied or sent that link from its details sheet inside the range (see block details)
- Total, all-time clicks, ignoring the range entirely
- Last, in plain words: "Just now", "5m ago", "2d ago", a date once it is older than a month, and "Never"
Sort by any column with the arrows in its header. The table starts ordered by clicks in the range, then by the order the blocks sit in on your page. On a phone the same columns are stacked per row, with a sort strip pinned above the list.
This is the table that tells you whether the thing you pinned to the top is the thing people actually want. If the third link is taking a third of the clicks, move it up. A link with shares but few clicks is one people are passing on rather than opening themselves, which is its own kind of signal.
Click-through rate
The small number under a link's click count is its click-through rate: the share of everyone who opened your page who then opened that link. Clicks divided by views, over the range you are looking at.
Share and click-through rate answer different questions. Share is about your other links: what fraction of the tapping went here. Click-through rate is about your visitors: what fraction of them tapped at all. A link can have a large share of a very quiet page, and a small share of a busy one and still be doing better.
It can go above 100%, and that is not a bug. One visitor can tap the same link twice, and on a small page a few people doing that is enough.
It appears once a range has at least 25 views. Below that, one click on three views would read as 33%, which is a number that means nothing, so the list says how many views the range has instead. Widen the range to bring it back.
Locations
A world map shaded by country, taken from the country each request arrives from, with the top countries listed beside it.
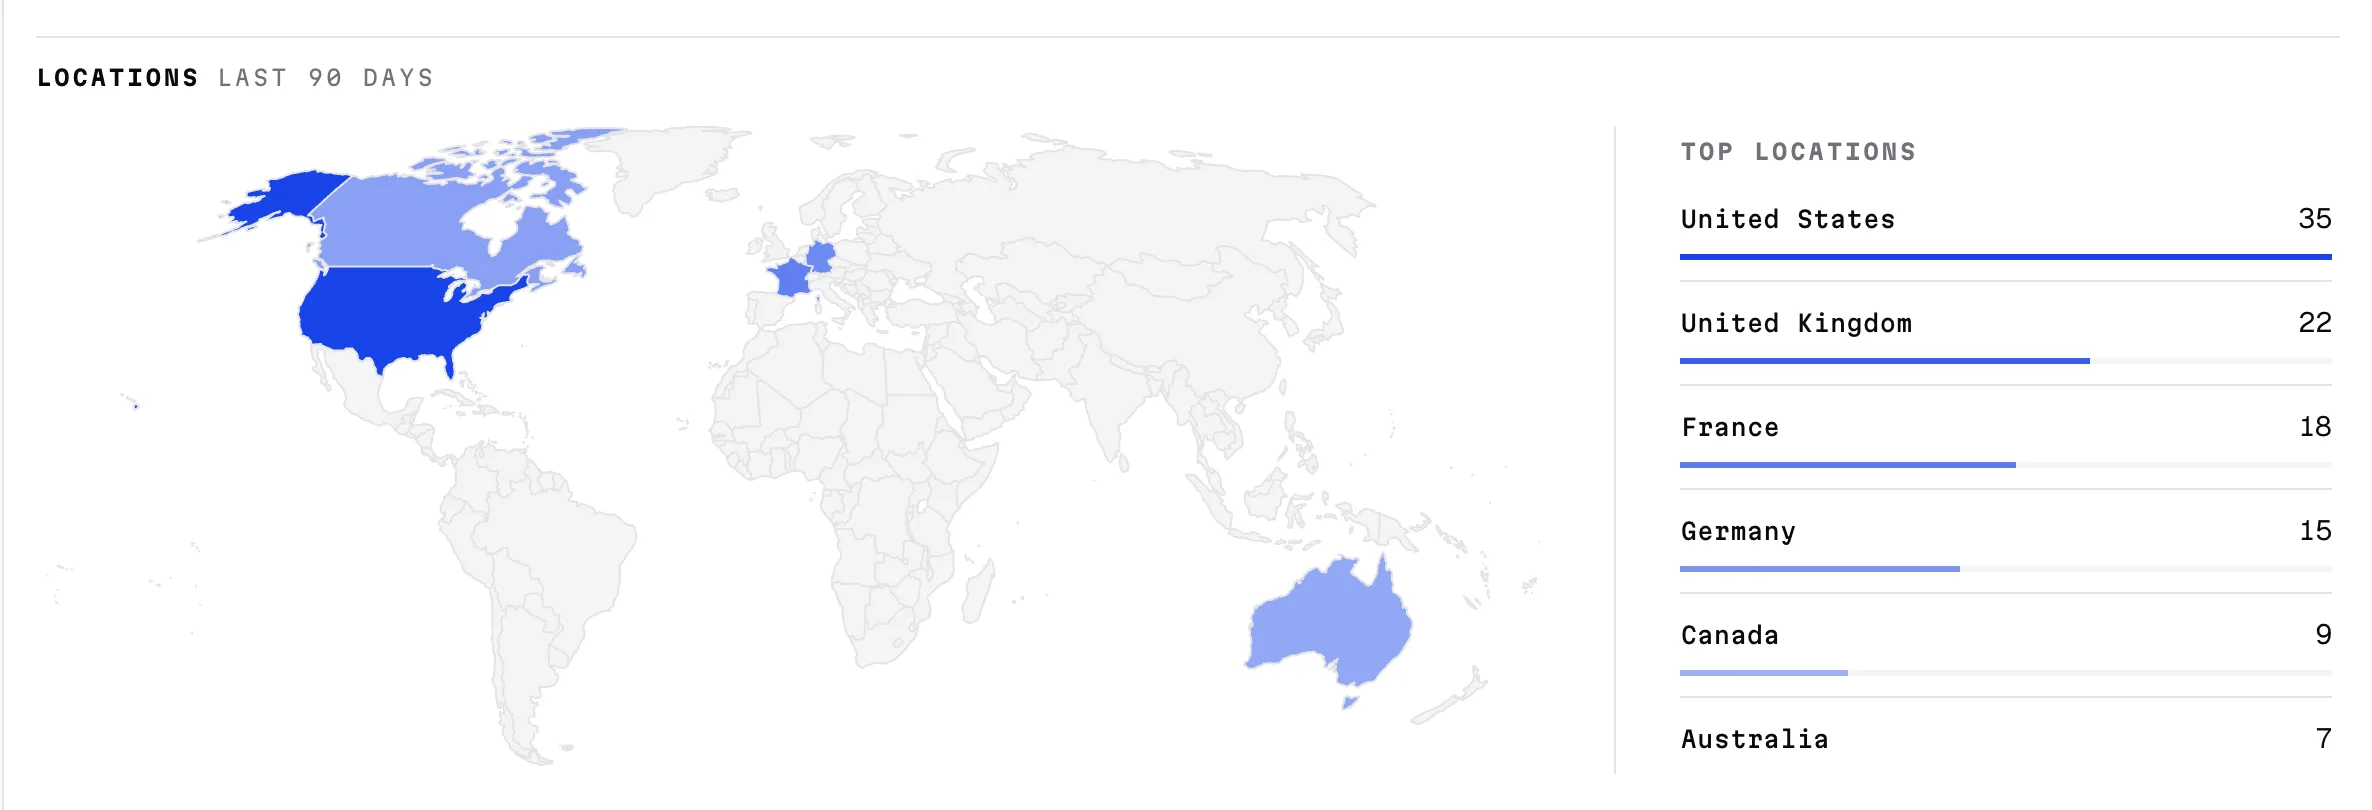
Hover a country for its count. Up to fifty countries are counted per range.
There is no drilling in
Nothing on this page filters anything else. Clicking a country does not filter the links table, and clicking a source does not filter the chart. The date range is the only control, and it applies to everything at once.
That is deliberate rather than missing: with one page and one link there is nothing to cross-reference that the three panels do not already answer on their own.
What urls.bio stores
Page views record the referring domain, the browser's user agent, and a country and city derived from the request. IP addresses are hashed with a secret salt and truncated before they are written, so the raw address is never stored and one visitor cannot be traced back to an address.
Link clicks record the link and the time, and nothing else. That is why the map and the source list cover views rather than individual clicks.
You can only ever read your own numbers. The aggregation runs on the database and refuses to run for anyone but the owner of the page, so this is not a check that lives in the browser.
Common questions
Why is there no click-through rate in the Studio? Because the click count on a block in the Studio is all-time, and a rate needs a matching span. Putting a 30-day rate next to an all-time count would be quietly wrong, so rates live here, where the range is on screen and you chose it.
Why is my click count lower than the taps I know I got? Bots are dropped and your own visits are dropped. A hidden link records nothing at all, so check that first.
The numbers have not moved since I looked a minute ago. The dashboard holds analytics for a minute before asking again. Reload the page if you want it sooner.
Why do Clicks and Total disagree on a link? They are counted two different ways. Clicks in the range come from the individual click records; Total reads a running counter kept on the link itself. When the two do not line up, the range column is the one built from the records.
Can I see which country a particular link's clicks came from? No. Clicks record the link and the time and nothing else, which is also why they cannot be traced back to a person.
I want this traffic in my own tools. Add a Google Analytics or Meta Pixel ID in integrations. urls.bio never loads its own analytics on your public page.